
Most third party web measurement firms have provided a steady drumbeat of positive growth news for Facebook over the years, as the company has gained tens of millions of users in the US and around the world. But now the social network appears to be reaching market saturation among internet users in some of its early key markets, with one firm showing nearly 75% of all US internet users on the site.
Instead of raw user growth, the numbers to watch going forward will be around engagement.
The saturation trend has become especially obvious in 2011 here in the US, its first and most important country by size and revenue. The graph below shows Facebook traffic from July of 2009 through the most recent numbers I could find from all publicly available data sources, including comScore, Compete, Quantcast, Nielsen, and Facebook’s own advertising tool (which provides rough reach estimates for advertisers buying targeted ads on the site).
The two most consistent sources of data that I have observed in the years that I’ve been tracking Facebook traffic trends are comScore and the ad tool, and they highlight saturation the clearest.
ComScore showed Facebook with 102.9 million unique US visitors in November of 2009, 151.7 million a year later, and 166 million last month. So around 15 million new visitors this year versus nearly 50 million in 2010. In terms of market saturation, comScore showed internet usage at 221 million unique visitors in November, indicating that 75% of all US internet users are now actively using Facebook. That’s more than any single other service on the web (although Google and Yahoo can appear larger if you combine all of their diffuse properties).
Similarly, the ad tool similarly showed Facebook with 99.3 million active users in November of 09, 145.3 million in that month of 2010, and 157.4 million last month.
Of course the company will do its best to reach the other 25% of the online population, through continuing to build out its products and platform and mobile devices. But that’s going to be more and more difficult, as it runs up against pockets of users who prefer using rival social networks, or no social networks at all.
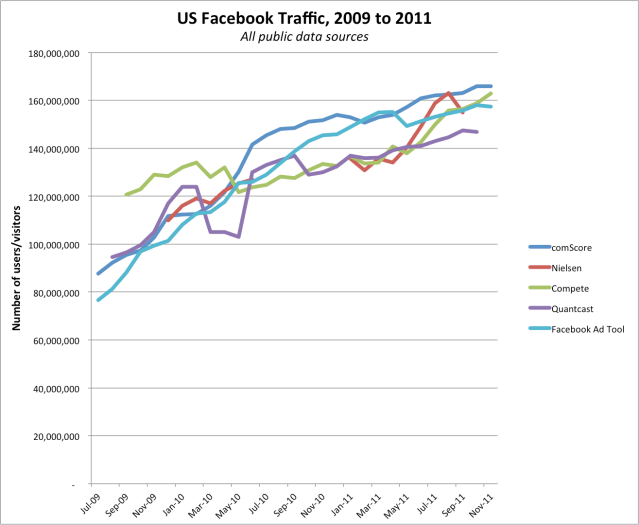
The other measurement firms have been all over the place, although they tell relatively similar stories when you zoom out from the monthly anomolies. Compete and Quantcast have regularly adjusted their methodologies after the fact. They haven’t said so, I’ve just observed that, so I’m left unsure of what to make of their Facebook findings. Meanwhile, Nielsen has irregularly published its numbers, (openly) announced methodology changes, and shown odd trends like a big drop in September (the last time it provided monthly US Facebook data).
In terms of engagement, Facebook has said over the years that around half of all users log on every day. Nielsen has more color here, showing that Facebook users spent an average of around 7 hours and 45 minutes on the site per month as of August and September, which is far more than any other site.
Facebook doesn’t provide official counts by country, and irregularly updates its worldwide user count — it last said it had 800 million active users, back at its f8 developer conference in September. But you can already see it focusing on engagement in terms of how it talks about itself. As founder and chief executive Mark Zuckerberg said at f8, ”the next era, the next 5 years, will be about apps and depths of engagement now that everyone has their connections in place.”
Source:http://techcrunch.com/2011/12/29/2011facebookmarketsaturationus/
Instead of raw user growth, the numbers to watch going forward will be around engagement.
The saturation trend has become especially obvious in 2011 here in the US, its first and most important country by size and revenue. The graph below shows Facebook traffic from July of 2009 through the most recent numbers I could find from all publicly available data sources, including comScore, Compete, Quantcast, Nielsen, and Facebook’s own advertising tool (which provides rough reach estimates for advertisers buying targeted ads on the site).
The two most consistent sources of data that I have observed in the years that I’ve been tracking Facebook traffic trends are comScore and the ad tool, and they highlight saturation the clearest.
ComScore showed Facebook with 102.9 million unique US visitors in November of 2009, 151.7 million a year later, and 166 million last month. So around 15 million new visitors this year versus nearly 50 million in 2010. In terms of market saturation, comScore showed internet usage at 221 million unique visitors in November, indicating that 75% of all US internet users are now actively using Facebook. That’s more than any single other service on the web (although Google and Yahoo can appear larger if you combine all of their diffuse properties).
Similarly, the ad tool similarly showed Facebook with 99.3 million active users in November of 09, 145.3 million in that month of 2010, and 157.4 million last month.
Of course the company will do its best to reach the other 25% of the online population, through continuing to build out its products and platform and mobile devices. But that’s going to be more and more difficult, as it runs up against pockets of users who prefer using rival social networks, or no social networks at all.
The other measurement firms have been all over the place, although they tell relatively similar stories when you zoom out from the monthly anomolies. Compete and Quantcast have regularly adjusted their methodologies after the fact. They haven’t said so, I’ve just observed that, so I’m left unsure of what to make of their Facebook findings. Meanwhile, Nielsen has irregularly published its numbers, (openly) announced methodology changes, and shown odd trends like a big drop in September (the last time it provided monthly US Facebook data).
In terms of engagement, Facebook has said over the years that around half of all users log on every day. Nielsen has more color here, showing that Facebook users spent an average of around 7 hours and 45 minutes on the site per month as of August and September, which is far more than any other site.
Facebook doesn’t provide official counts by country, and irregularly updates its worldwide user count — it last said it had 800 million active users, back at its f8 developer conference in September. But you can already see it focusing on engagement in terms of how it talks about itself. As founder and chief executive Mark Zuckerberg said at f8, ”the next era, the next 5 years, will be about apps and depths of engagement now that everyone has their connections in place.”
Source:http://techcrunch.com/2011/12/29/2011facebookmarketsaturationus/
No comments:
Post a Comment